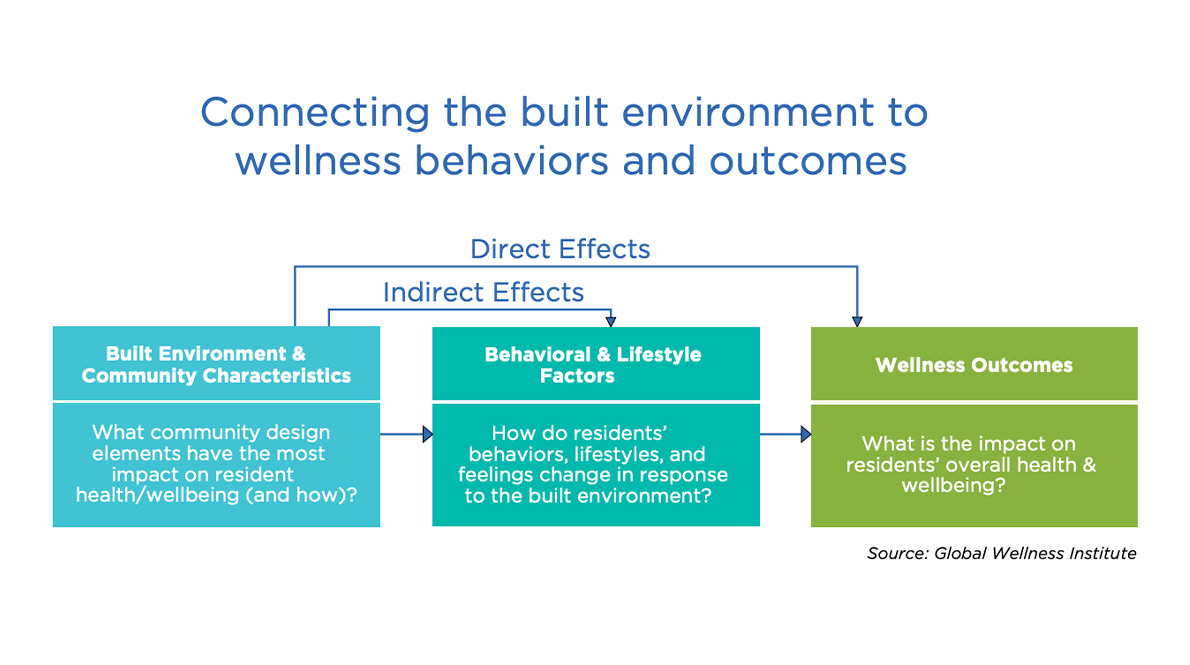
One challenge in making a case for wellness real estate and communities is a lack of metrics that measure the diverse benefits for residents—crucial data for developers and investors. To remedy this, the GWI has created a dashboard of elements to measure in surveys and studies—from how the community supports behavior change to how they foster a sense of community and belonging.
Read more about why we need metrics for wellness communities and how to create them.
Better metrics are crucial to document and communicate the benefits of wellness communities to residents, planners, builders, and investors.
Creating a wellness “dashboard”
One of the continuing challenges in making the case for wellness lifestyle real estate and communities is the lack of an established system or metrics to measure and document their many benefits and impacts for residents.xciv To date, only a small handful of communities and developers have completed and published findings from such research (as described in the previous section). In Appendix F, we describe four different research methodologies that can be used to measure health impacts within communities, along with examples of communities that have conducted (or are in the process of conducting) such studies: longitudinal studies, community-based health and wellness impact evaluations, multi-community health and wellness benchmark studies, and health impact assessments.
Rigorous scientific studies that aim to link a specific built environment factor to a specific behavior or health outcome require a level of resources, time, and expertise that is not available or practical for most developers and communities. While such studies are highly valuable, demonstrating the many potential impacts of wellness lifestyle real estate and communities does not have to be so difficult and costly. We already know that our built environment has direct impacts on our health, as well as indirect impacts by influencing our daily choices and activities. So, it would be useful to measure the behaviors and experiences, as well as the wellness outcomes, of people who live in wellness lifestyle real estate and communities.
Below we propose a simple framework for establishing a wellness lifestyle real estate “dashboard” of metrics. This framework captures three key areas of wellness impacts that can be delivered by wellness residential projects: 1) health and wellbeing outcomes, 2) wellness behaviors, and 3) a sense of community. Within each area, we propose a set of sample metrics or indicators, all of which could be collected by surveying or interviewing community residents. The dashboard and indicators could potentially be used for conducting several types of evaluative studies:
• A pre/post study to measure residents’ behaviors and health both before and after they move into a wellness community.
• A time series study that asks residents the same questions at set intervals to track longer-term, incremental changes – in essence, a “performance monitoring” mechanism, with periodic check-ins to ensure that the wellness community continues to deliver its intended benefits for residents over time.
• A control study that compares residents in the wellness community to those in a community without intentional wellness features.
• A benchmark study that compares residents’ answers on key questions to third-party data at the regional/national level, or across multiple communities – for example, do wellness community residents perform better than regional/national averages on key wellness indicators? (See Appendix F for a list of some third-party datasets and sources that could be used for this kind of benchmarking.)
Wellness Dashboard: Capturing the Impacts of Wellness Lifestyle Real Estate and Communities
Category 1: Protect and improve our health and wellbeing
Potential Indicators:
• Self-evaluation of general feeling of happiness
• Self-evaluation of overall life satisfaction
• Self-evaluation of personal state of health (excellent, good, fair, poor)
• Frequency of feeling very healthy and full of energy
• Frequency of not getting enough rest or sleep
• Frequency of bad physical health days (including physical illness and injury)
• Frequency of bad mental health days (stress, depression, and problems with emotions)
• Frequency of not being able to engage in normal daily activities, such as self-care, work, or recreation, due to poor physical or mental health
• The types of health problems that limit normal daily activities
Category 2: Support behavioral change and healthier lifestyles
Potential Indicators:
• Healthy eating habits (e.g., meeting recommended nutritional guidelines)
• Daily/weekly consumption of fresh fruits and vegetables
• Time spent walking per day/week • Time spent on moderate to rigorous physical activities per day/week (e.g., meeting recommended physical activity guidelines)
• Average time spent in the car per day/week
• Use of trails, parks, greenways, waterfronts, etc. for exercise or recreation
• Time spent per day/week in nature or natural settings for relaxation and rejuvenation
• Use of recreational/athletic amenities and services for exercise and recreation (e.g., fitness centers, swimming pools, sports fields, classes, etc.)
• Use of wellness amenities and services (e.g., spa, meditation spaces, etc.)
• Use of preventive health services (e.g., health checkups, recommended screenings, etc.)
• Participation in/frequency of sustainable and green practices (e.g., recycling, composting, using renewable energy, carpooling, use of public transit, CSA participation, gardening, etc.)
Category 3: Foster a sense of place, community, and belonging
Potential Indicators:
• Meaningful friendships and associations with other people in the neighborhood (for both adults and children)
• General friendliness among neighbors, such as regular chatting
• Likelihood/frequency of seeking advice, borrowing something, or socializing among neighbors • Satisfaction with facilities to socialize with friends, family and neighbors (e.g., community center, parks and playgrounds, other public places)
• Feelings of safety in the neighborhood
• Participation in social events, activities, and meetings within the community
• Willingness to work with others on something to improve the community
• Feeling of empowerment – being “heard” and the ability to influence what is happening in the community
• Feeling of inclusion, that everyone is welcome in the community
• Feeling that individual health/wellness is connected to the sustainability of the environment
How to use the wellness “dashboard”
The dashboard framework proposed above is intended to be modular and flexible. It is designed for conducting an evaluation or benchmark-type study, drawing upon established social science research methodologies (see Appendix F for a description of these types of studies). A few simple steps are required to put this dashboard to use:
• Select which categories and indicators are to be studied (not every indicator in the proposed dashboard will be relevant for every wellness lifestyle real estate or community project).
• Determine the study approach: pre/post study, time series study, benchmark study, or control study?
• Determine the data collection methodology: electronic survey, structured interviews, focus groups, or mixed methods?
• Formulate survey/interview questions for each indicator (these will depend upon the study method to be used, and whether questions will be benchmarked against third party data sources).
• Publicize the study/survey and recruit partici-pants.
• Implement study/survey.
This kind of study can easily be conducted by a developer and/or a research partner within a single neighborhood, building, or community, and would require relatively little financial investment. An even more powerful approach would be for multiple developers/communities to work together and apply the same study/survey approach across multiple projects. As more communities and their developers experiment with different approaches for capturing their wellness impacts, the hard evidence for the wellness case will become clearer over time.
See the full GWI report for more information
lxxviii The continuum concept is adapted from Dr. Jack Travis’ Illness-Wellness Continuum. Travis was one of the pioneers of the modern wellness movement in the 1970s.
lxxix Institute of Medicine (2006). Genes, Behavior, and the Social Environment: Moving Beyond the Nature/Nurture Debate. Washington, DC: The National Academies Press. https://doi.org/10.17226/11693.
lxxx For more information on the determinants of health see, for example:
1) WHO, Health Impact Assessment: The Determinants of Health, http://www.who.int/hia/evidence/doh/en/.
2) U.S. Centers for Disease Control, NCHHSTP Social Determinants of Health FAQ, https://www.cdc.gov/nchhstp/socialdeterminants/faq.html.
3) ODPHP, Determinants of Health, https://www. healthypeople.gov/2020/about/foundation-health-measures/Determinants-of-Health#biology%20and%20 genetics.
4) Robert Wood Johnson Foundation, Social Determinants of Health, http://www.rwjf.org/en/our-focus-areas/topics/social-determinants-of-health.html.
5) Australian Institute of Health & Welfare, Australia’s Health 2016: Determinants of Health, http://www.aihw. gov.au/australias-health/2016/determinants/.